What changed, and where it went
Commits, diffs, builds, test reports and the promotion trail.
The commit graph
Commits as nodes, branches as lanes, and what the platform did with each one.
Open inkwell-web's history →Branches are lanes that persist down the page and curve back into the trunk at their merge base. Open a row for the message body, the builds, the environments it reached and its pull requests.
The annotations are the part a general git viewer cannot do. Anyone can draw a commit
graph; "live in production, built twice, and this is what PR 7's review environment
forked from" is knowledge only the platform has. A pull request's base commit is
marked forks here and names the review-pr-<n> environment and the -pr-<n> component
suffix.
Commits and diffs, in the console
Links to git.jung.town/<org>/<repo>/commit/<sha> return 404, not 403, for anyone
without a Gitea session. All twelve application repositories are private, and Gitea will
not confirm a private repo exists. The URL is correct; the reader has no session.
So commits render here instead, read with the console's own token.
/commits/<org>~<repo>/<sha> — subject, message body, author, parents, and the coloured
diff per file.
The repository slash is written as ~. Not URL-encoded: %2F in a path segment is
rejected or silently normalised by enough proxies that it is not worth relying on, and it
makes a link nobody can read aloud.
/commits/<org>~<repo>/<base>...<head> — every commit between two points, newest first,
spelled the way Gitea spells it so a pasted compare URL transfers.
The deploys page shows what went live and what was in it, built from the delivery metric and Gitea's compare endpoint.
Builds and their tests
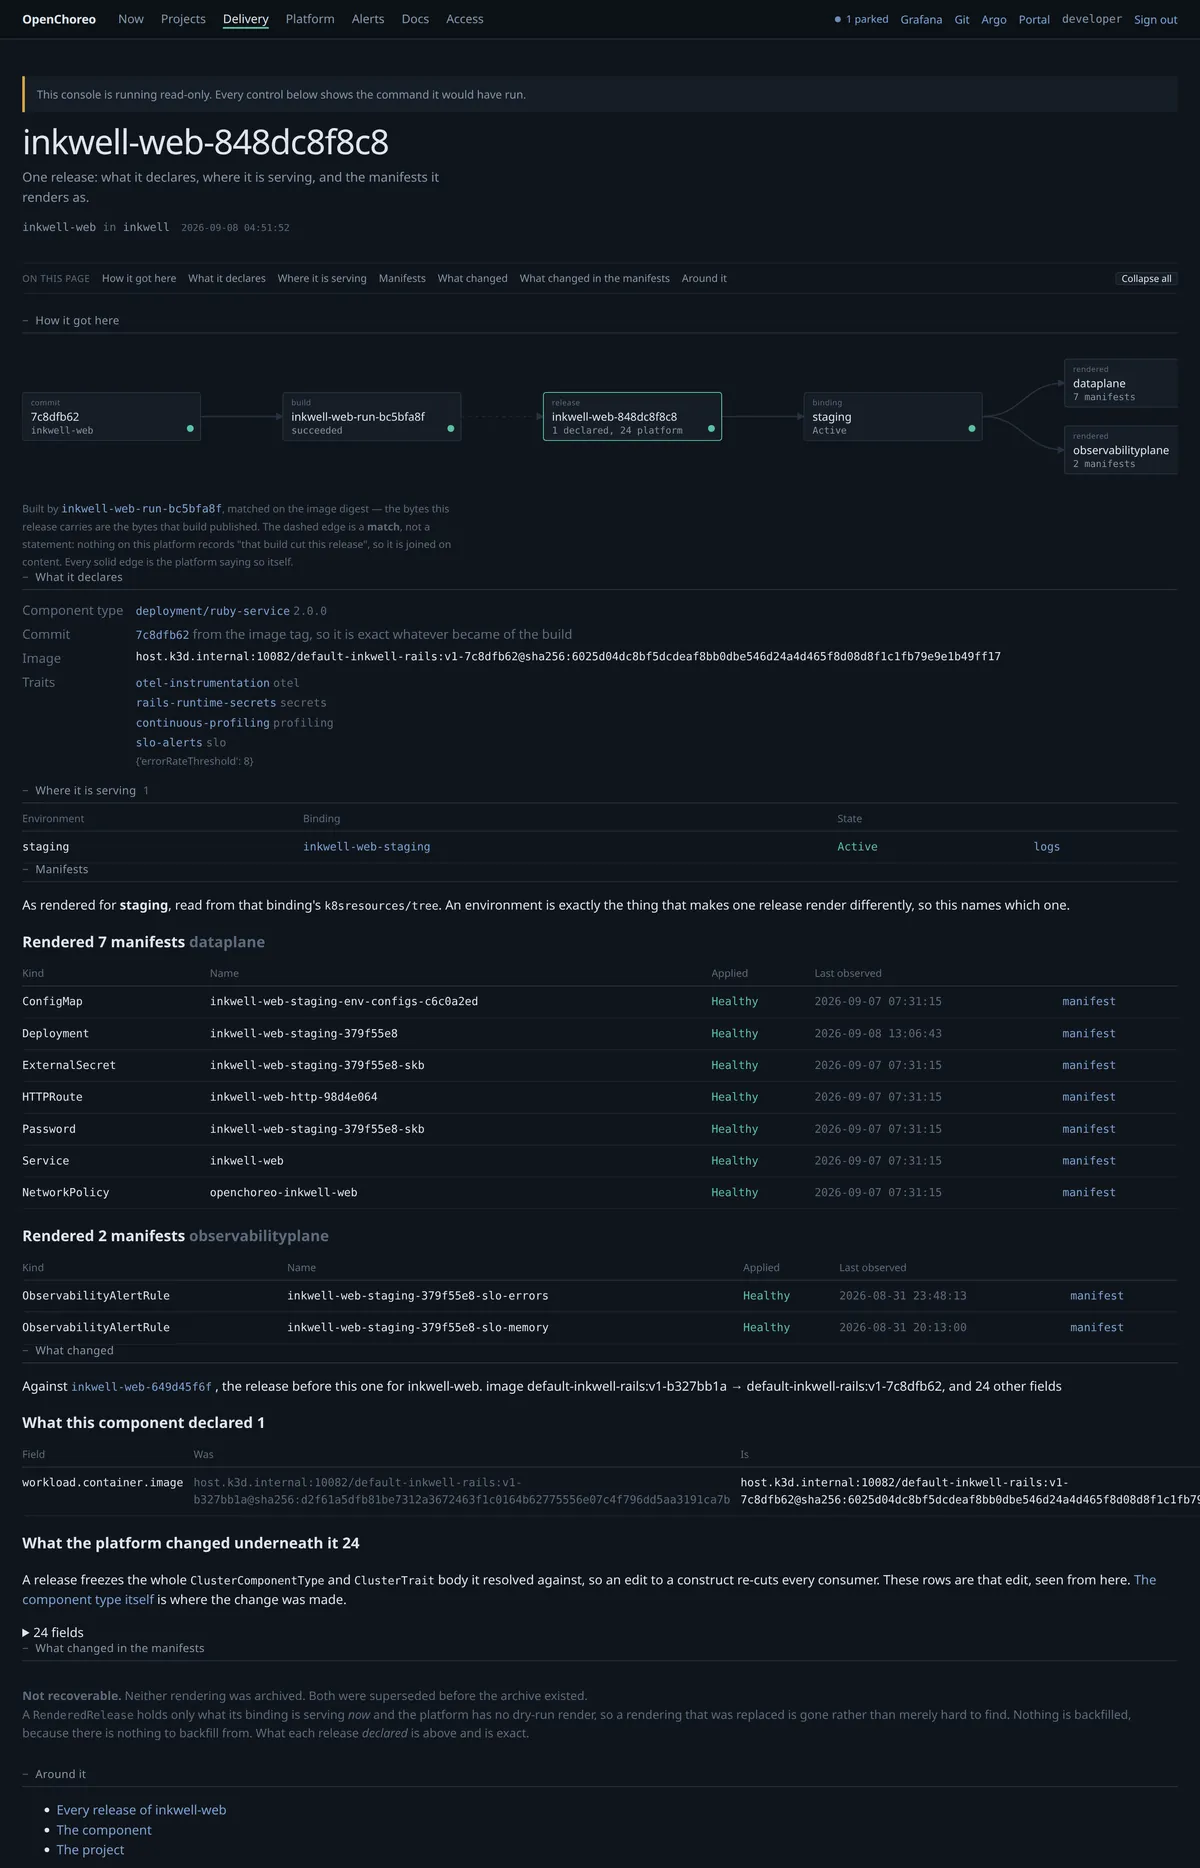
A release page is where the trail ends: what it declares, where it is serving, and every manifest it rendered.
- 1
The build page
Stages with cache verdicts, the trace, per-stage logs and the commit diff in place.
- 2
The test report
Totals, failures first with their message and captured output, the ten slowest cases, and every case filterable by outcome and suite. Both filters live in the URL, so a filtered report is a link.
The platform writes a real
junit.xmlper run — pytest natively, the rspec plugin by hand — but this page reads the per-test log records instead, because the XML never leaves the build container: the artifact store is ClusterIP on the workflow plane and this console runs on the data plane. - 3
A missing duration is missing
Not zero. Zero would make an untimed test look instant, sort it below every real one, and report a 220-case suite as taking 0.00s — which reads as a fast suite rather than as absent timings.