Following one request across six services
A trace, what it is joined to, and the three places a trace stops being useful — with what to reach for instead.
Every request on this platform carries a trace, and the console's job is to make the trace the start of an investigation rather than the end of one.
Recent traces, filterable, with a TraceQL box for when you know what you want.
Trace search →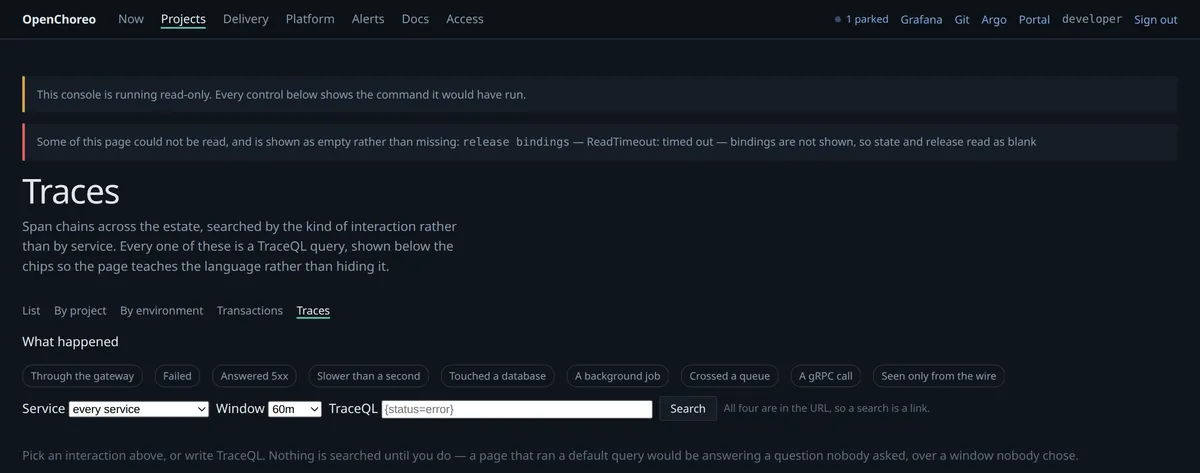
What a trace is joined to here
A waterfall on its own tells you which span was slow. These pages tell you why, because the trace is joined to everything recorded at the same moment.
| from a span | you can reach |
|---|---|
| its service | that component's page, its profile, its logs |
| its time range | the CPU profile covering exactly that window |
| its trace id | every log line carrying the same id, across every service |
| its build | the commit that produced the running image |
A bot reply in chat ends with a transaction link. That is this page, narrowed to the exact request the reply came from — which is the shortest path from "that looks wrong" to the waterfall of the thing that looked wrong.
Six services, one waterfall
@Inkwell Bot add Hello | my first note is the demo worth running, because it
crosses the most boundaries:
- 1
inkwell-web takes the write
Rails, Postgres, and a job enqueued.
- 2
inkwell-worker picks the job up
A different process, so this is where a naive trace stops — the span only continues because the job carries the trace context through the queue.
- 3
enrich embeds it
A FastAPI service, one HTTP hop.
- 4
ledger records it
gRPC, which is a different instrumentation path again.
- 5
Garage archives the blob
An object store, outside the mesh.
Where a trace stops helping
A single span covering 900ms tells you the method was slow, not which part. That is a profile question: the flame graph over the same window says which frame held the CPU.
The running service, right now, as a flame graph.
A live CPU profile →Waiting on a lock, a connection pool, or a downstream service does not appear in a CPU profile — the process is not running. The trace's own child spans and the component's saturation metrics are what show it.
Guide Three kinds of slow is the long version of this distinction.
Tempo keeps about forty-eight hours here. A chain older than that is placed from recorded times rather than from spans, and the page says so rather than drawing a waterfall it is guessing at.
Transactions, when you do not have a trace id
A transaction is the aggregate: one row per named interaction, with its rate, its error share and its latency — and a link into the traces behind each.
Or per project, from a project's own Transactions tab.
Transactions, estate-wide →
That is the usual direction of travel: notice a shape in the aggregate, open one of the traces underneath it, and land in the waterfall with the profile beside it.