What the tests and the build cache actually say
Test reports as a platform standard rather than per-language luck, and reading a cache verdict without fooling yourself.
Tests are a platform contract
Every language on this platform emits the same test report, because "did the tests pass" should not depend on which runner a team picked.
The contract is small: a JUnit XML file in a known place, plus a per-test resource summary. The platform reads it, the build page renders it, and the build fails on it.
Names, durations, failures with their output, and per-test memory.
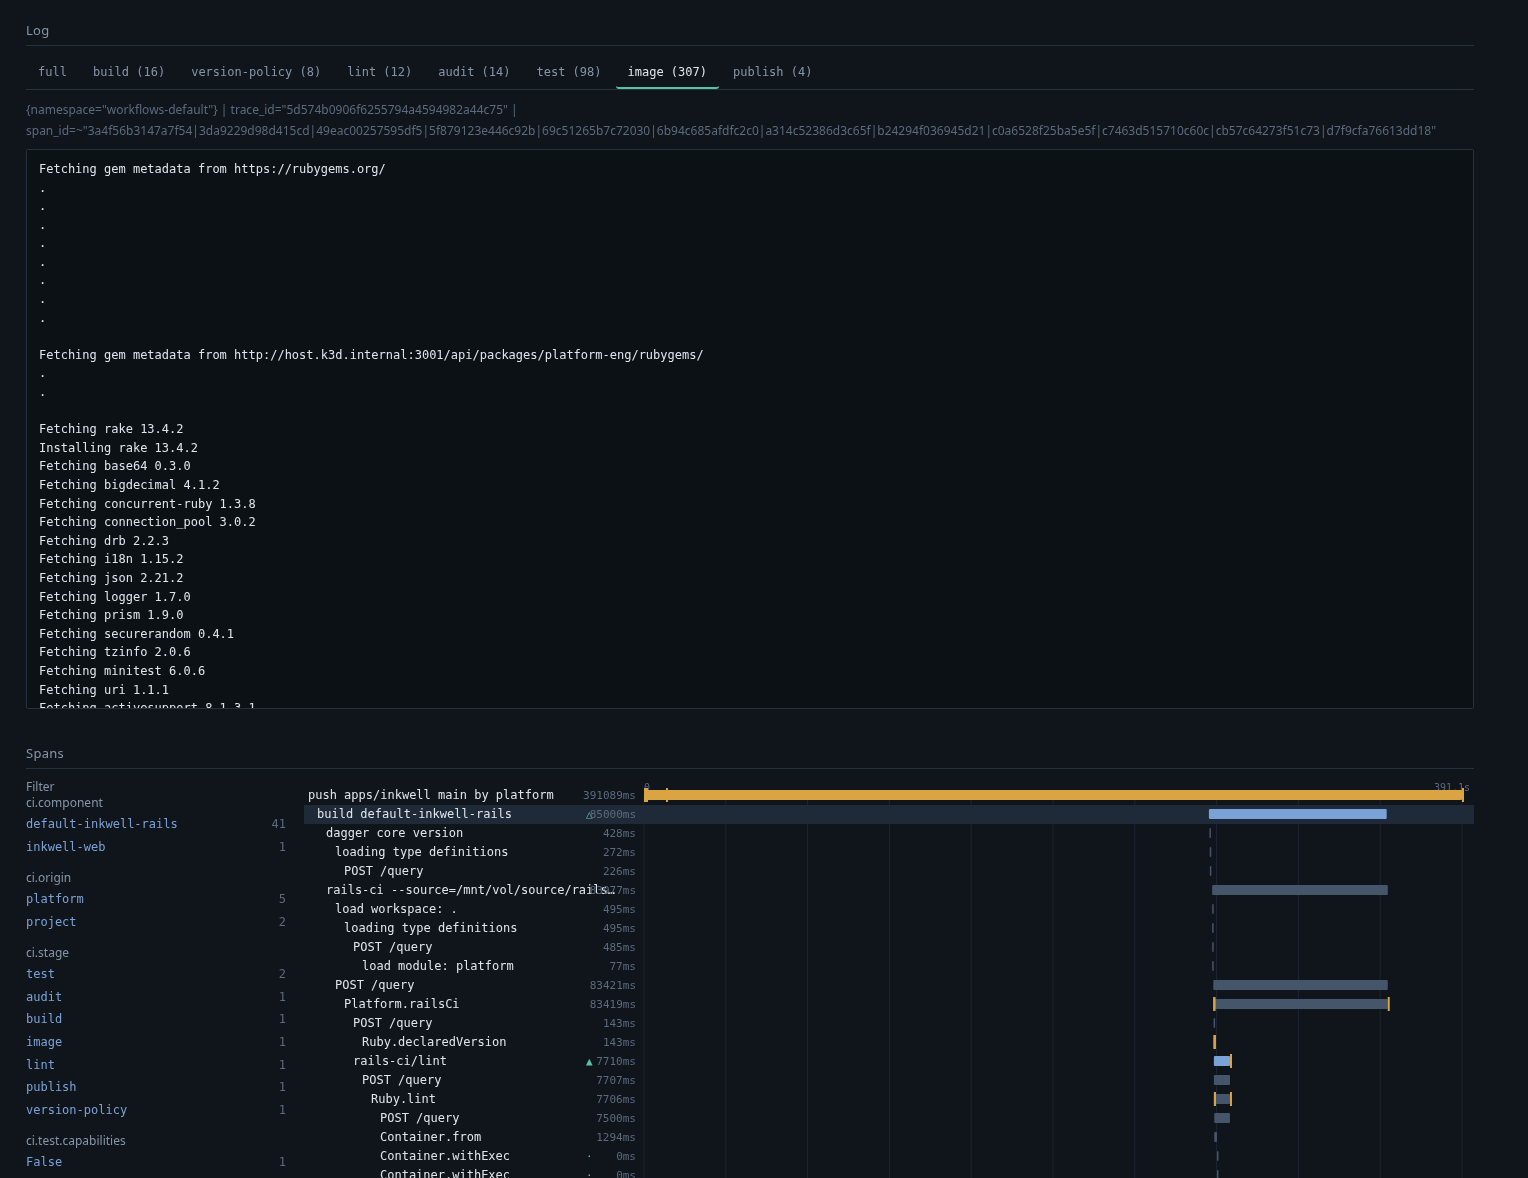
Open a build, then its Tests tab →The log is split by stage rather than run together, so "which step was slow" and "which step failed" are the same question. The span waterfall underneath is the same build seen as a trace:
A per-test number that is always zero looks healthier than a missing column, and
is worse. The Ruby memory ceiling reported exactly 0 for every example for
days: Process.getrusage does not exist in Ruby, and the call sat inside a
rescue that swallowed it.
The fix that keeps it fixed is an oracle — two tests per language asserting a number somebody already knows, like "this holds 64 MiB" or "this burns about a second of CPU in one frame". If you add a profiler or a memory counter here, add an oracle in the same change.
The cache tells you what it saved, or admits it does not know
Per build, per stage: hit, miss, or not cacheable, and why.
Cache verdicts →Three things make a cache figure easy to misread, and the page names each:
A cached stage that took 200ms and would have taken 300ms is a hit and is not a saving. Hit rate flatters this; elapsed time does not.
The first build after a dependency changes must miss. Counting it against the cache makes the number worse exactly when the cache is behaving.
A stage with a session-scoped token in it, or one that publishes, cannot be cached and never will be. That is a different row from a miss, and merging them makes the ceiling look reachable when it is not.
Build duration includes the wait
There is one build lock, so elapsed time is two numbers and the platform records
them separately: queued_seconds and the running time. Adding them and calling
the total "build time" makes a busy platform look like a slow one, and sends
people to optimise a Dockerfile when the answer is concurrency.
The build page prints "Building for 40s, after waiting 2m for the build lock" rather than "3m". A number that is two facts should be two numbers.