Profiles and flame graphs, in CI and in production
Where profiles come from, which questions each kind answers, and how to read a flame graph without being misled by it.
Two different things on this platform are called a profile, they are collected in two different circumstances, and they answer two different questions. Mixing them up is the most common way to reach a confident wrong conclusion here.
| In CI | Deployed | |
|---|---|---|
| what it profiles | one build — a stage, or a single test | a process serving real traffic |
| how it gets there | the pipeline injects a profiler for the run | the continuous-profiling trait, always on |
| window | the build's own, minutes | rolling, whatever you pick |
| answers | "why is this change slow, or fat" | "where is this service spending itself" |
| where | the build page | /components/<name>/profile |
The rule of thumb: CI profiles are about a change; deployed profiles are about a workload. A test that got slower is a CI question. A service that is at 80% CPU at 3pm every day is a deployed question. Neither answers the other.
In CI: what the build spent, and on what
Every build reports where its CPU went, per stage.
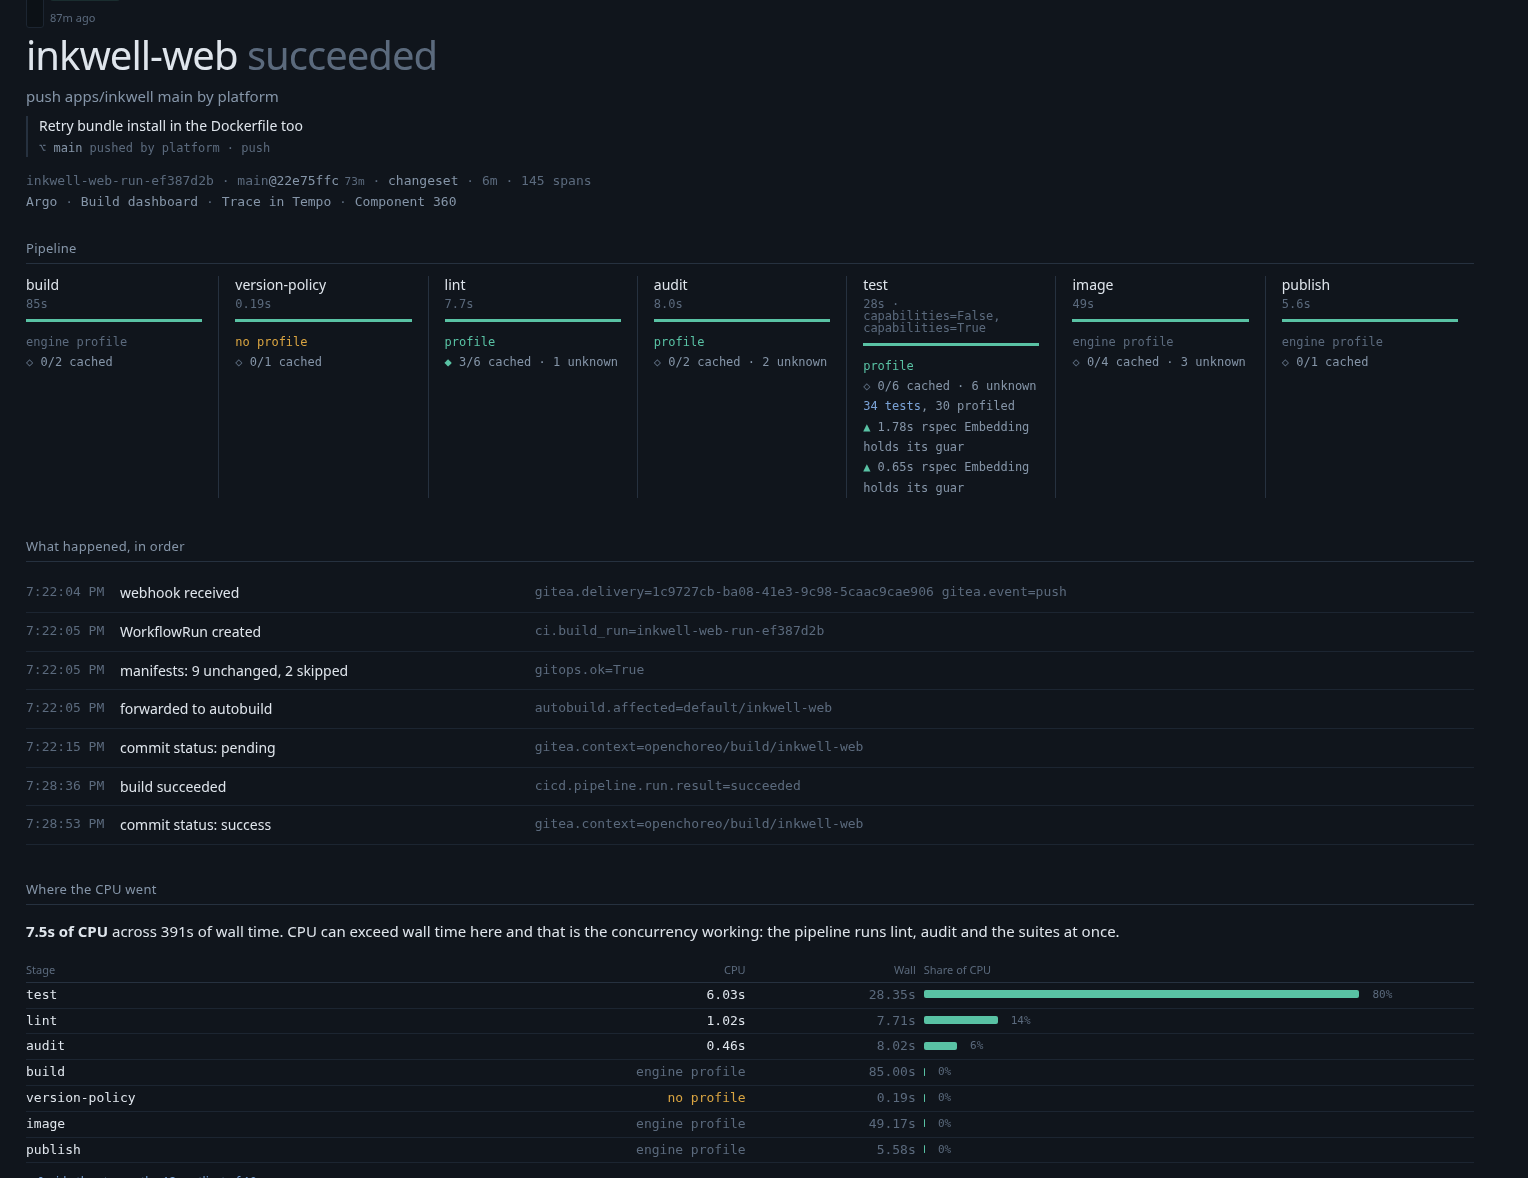
Three things on that page are worth knowing before you read any number on it.
CPU can exceed wall time, and that is the concurrency working. 7.5s of CPU across 391s of wall is not a contradiction: the pipeline runs lint, audit and both RSpec suites at once. If CPU ever equalled wall time, something would be serialised that should not be.
Not every stage can have a profile, and the page distinguishes three reasons.
profile— a profiler ran and produced samples.engine profile— the work happened inside BuildKit (the Dockerfile build, the registry push). No in-container profiler can reach it, so what you get is the Dagger engine's own CPU across that window. Read it as a shape, not as a cost: the engine may have been doing other builds' work in the same window.no profile— nothing to attach to.version-policyreads two files and compares strings;fastapi-ci/lintis ruff, a Rust binary a Python sampling profiler cannot enter.
That last distinction matters more than it looks. "No profile arrived" is a defect worth chasing. "This stage cannot carry one" is not, and a page that renders them identically sends you looking for a profiler that was never installable.
A stage's CPU includes what happened while no span was open — booting Rails,
loading a linter's configuration. Open Inside the stages and the largest row
is often outside any span (suite boot, tool startup). That is real time and
usually the first thing worth attacking, because it is paid on every build and
belongs to no test.
Reading the flame graph
Click any span in the waterfall. Spans marked ▲ have a profile.
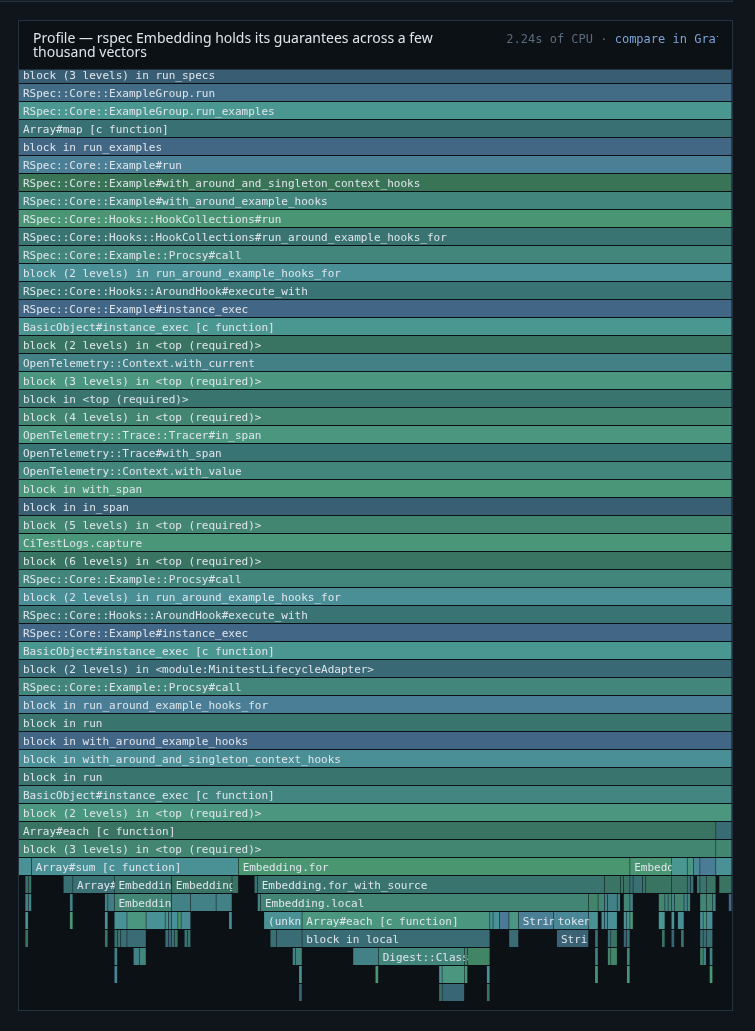
Width is time; the vertical axis is the call stack, top to bottom. What surprises people is how much of a Ruby flame graph is not their code: the first sixty levels here are RSpec, its hooks, and the OpenTelemetry wrappers, each one full width because every sample passed through them. That is not waste — it is the frame stack every sample shares — and it is why you scroll.
The interesting part is where it fans out. At the bottom, Embedding.for splits
into Embedding.for_with_source, Embedding.local, Digest::Class and a scatter
of string work. The first level with more than one wide box is where your code
starts.
A single linear stack is not a flame graph. A millisecond-long test produces one sample: every level holds one frame at full width with no self time, and the drawing is N identical bars. The console says so instead of drawing it — at 100 Hz a span shorter than ~10ms was never going to be sampled twice. An empty or flat profile there means the span was fast, not that profiling is broken.
The header says 2.24s of CPU, not a sample count. Pyroscope's CPU profile
type is process_cpu:cpu:nanoseconds, so the raw number is nanoseconds; anything
labelling it "samples" is lying about the unit.
Memory: two measurements, and they are not interchangeable
A build asked to be fully profiled also runs a memory profiler.
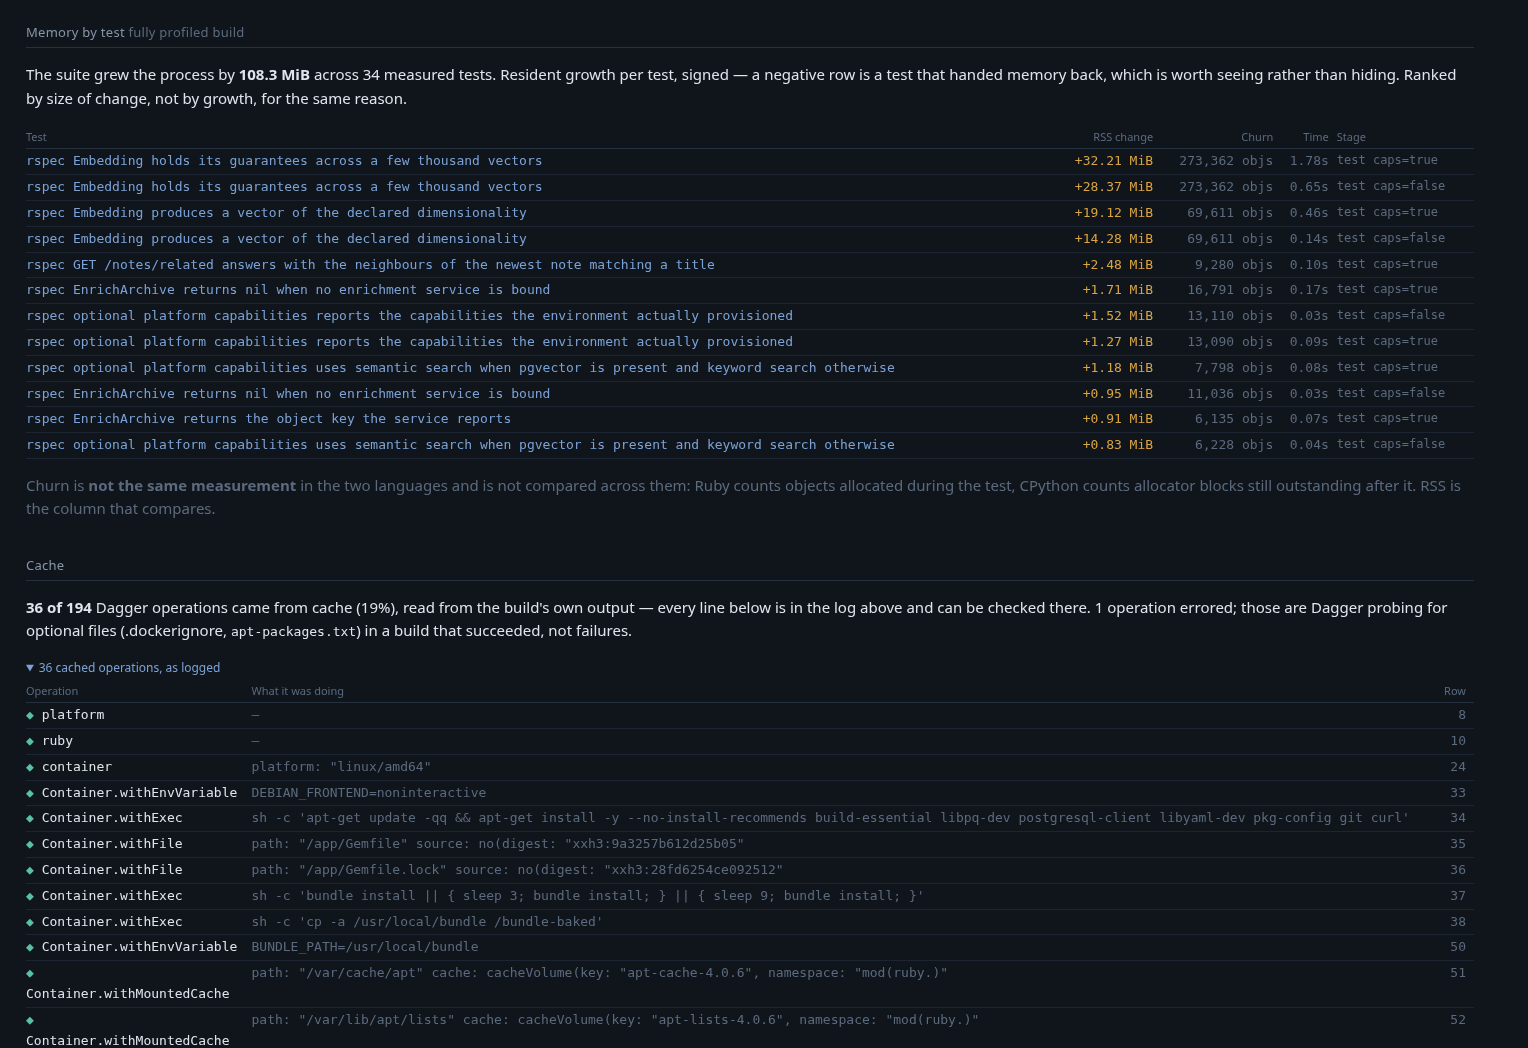
- RSS change is what the container had to hold. Signed, so a test that hands memory back shows as a negative row — worth seeing rather than hiding. This is the column that compares across languages.
- Churn is not the same measurement in the two languages and is never compared across them: Ruby counts objects allocated during the test, CPython counts allocator blocks still outstanding after it.
The flame graph for the retained profile is in bytes, and the panel says so, because it shares a canvas with the CPU profiles and the axis would otherwise change meaning between two clicks.
Ruby has no heap profiler in production. The pyroscope gem is CPU-only and
no setting changes that, so a Rails leak is found with these CI profilers or with
a heap dump. Python can profile the heap — set memoryProfiling: true on the
component's continuous-profiling trait — and Go pushes the full memory set
already.
Deployed: where a running service spends itself
Pick an operation and a window; both are in the URL, so a profile is a link you can send.
Open a service profile →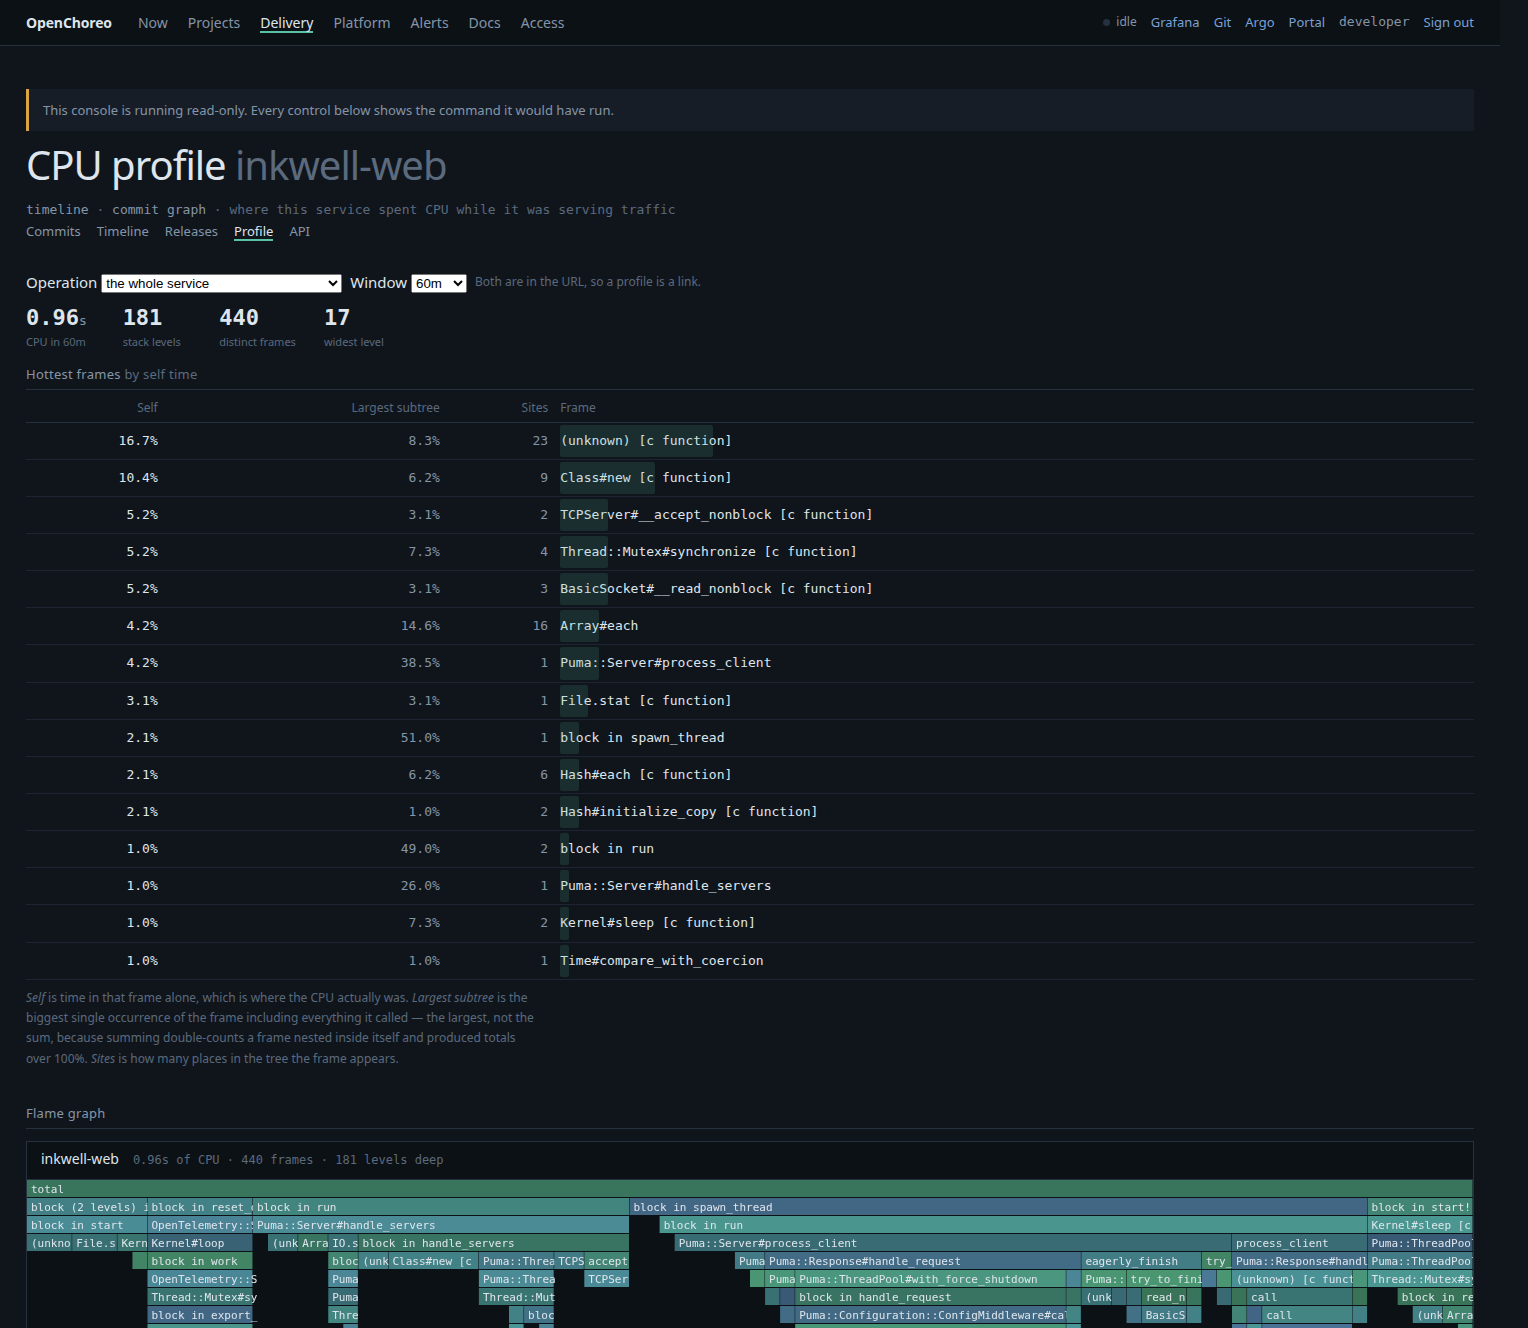
The table above the flame graph is usually faster to read than the drawing.
- Self is time in that frame alone — where the CPU actually was. Sort by this to find the hot code.
- Largest subtree is the biggest single occurrence of that frame including everything it called. It is the largest, not the sum, because summing double-counts a frame nested inside itself and produces totals over 100%.
- Sites is how many places in the tree the frame appears. A frame with high self time and one site is a specific hot spot; high self time across twenty sites is a cost spread through the codebase, and the fix is different.
In the shot above, Puma::Server#process_client has 4.2% self and a 38.5%
subtree: the server loop itself is cheap and everything under it is the work.
That is the normal shape for a healthy web process, and its absence is the
interesting case.
Using this to diagnose something
A span with no profile is not a span with no work. Samples go to the INNERMOST open span, so a span whose children do the waiting — a background job that spends its time in the database and in HTTP calls — shows nothing of its own however long it ran. Check what is beneath it before concluding the profiler missed it.
"A worker was OOMKilled." Profiles are the third step, not the first. Look at the memory series between restarts first: a rising floor is a leak, a plateau with spikes is a limit that is too low, and raising the limit "fixes" both while only being correct for one. The OOMKilled runbook has the whole sequence.
"This build got slower." Compare Where the CPU went between two builds before opening any flame graph. The stage that moved tells you which flame graph to open, and often the answer is that nothing moved and the build simply lost a cache — which the Cache section on the same page will tell you outright.
"A test is slow." Its span carries the profile. But check the stage's
outside any span row first: if suite boot dominates, no individual test is the
problem.
"A service is hot." Deployed profile, sort by self time, then narrow the Operation selector to one endpoint and compare. Changing the window is how you tell a steady cost from a spike.
Profiles cost something, and it is not zero. Sampling runs at 100 Hz by
default; a heap profiler hooks the allocator and is off unless asked for. The
unpriced risk on this platform is span_id as a per-sample label — unbounded
cardinality at 100 Hz on every profiled service — so widen profiling
deliberately rather than by default.
Where each thing lives
- Build page → Where the CPU went, per-stage logs, per-test memory, the waterfall and its flame graphs.
/components/<name>/profile→ the deployed CPU profile, by operation and window.- Grafana → compare in Grafana from any flame graph, for two profiles side by side, which this console deliberately does not try to do.