An alert fired — what to read, in what order
Where alerts come from, why each one carries a runbook, and how to get from a firing alert to the log line and the commit behind it.
An alert that does not tell you what to do is worse than no alert: it trains people to close it. Every rule on this platform carries a runbook link, and the relay that posts it into chat carries the same links the console does.
Every firing alert, with what it is about and where to go next.
What is firing →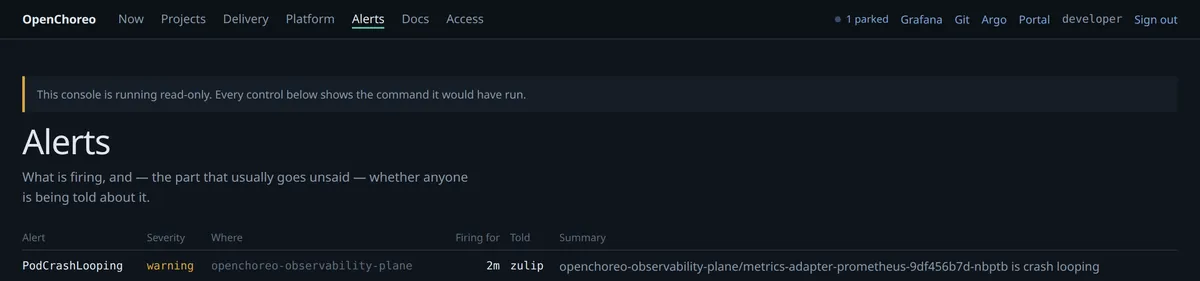
The order to read them in
- 1
What is the alert actually measuring
An SLO alert on error rate and a
PodOOMKilledare different kinds of claim. The first is about users; the second is about one process and may not have reached a user at all. The alert says which. - 2
Is it one component or the cell
The component's page says whether this is the only thing unhappy. A whole environment degrading and one component degrading are different investigations, and the second is much more common.
- 3
What changed
The component's timeline says what deployed and when. Most alerts that start suddenly start after something, and the deploy stream is where "what happened at 14:20" is answerable.
- 4
The logs, narrowed
Not "the logs" — the logs for that component, in that environment, around that minute.
Filterable by component, environment, level and text, and by trace id.
Logs, per project →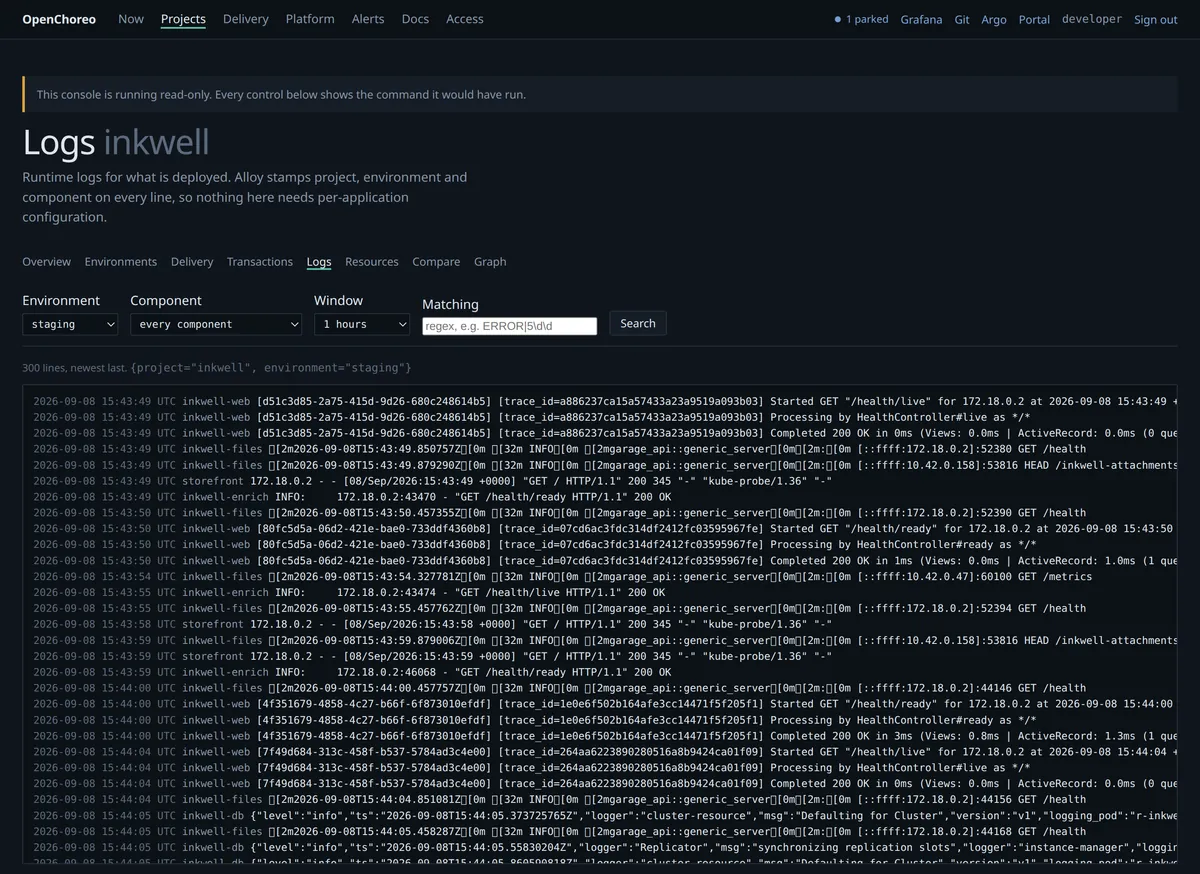
The runbook is a guide, and it is in here
PodOOMKilled links to A worker was OOMKilled — is it a leak or a limit, in
this same set. That is deliberate: a runbook that lives in somebody's notes is a
runbook nobody reads, and one that ships with the console versions with the
pages it describes.
The OOMKilled runbook is the one to read before you raise a memory limit. A leak and a limit that is merely too low look identical from the alert, and raising the limit on a leak buys hours and then fails again at a worse time.
An alert that could not resolve
Worth knowing, because it looked like a broken alerting path and was not.
A log-based rule fires on the presence of matching lines. When the condition clears, the lines stop being emitted — and a rule written the obvious way then has no series at all rather than a series reading zero. No series means no evaluation, which means the alert never resolves; it just sits there firing at something that stopped.
The relay strikes through a resolved alert in chat rather than deleting the message, so the thread reads as a history rather than vanishing.
Making one happen
There is a deliberate fault to inject, which is the honest way to test that any of this works:
kubectl --context k3d-openchoreo-dp apply \
  -f platform/openchoreo-config/fault-injection/deny-db-egress.yaml
# seconds:  503s, PG::ConnectionBad in the logs, DROPPED flows in Hubble
# 20 min:   PodNotReady fires
kubectl --context k3d-openchoreo-dp delete \
  -f platform/openchoreo-config/fault-injection/deny-db-egress.yaml
Which alert, and why it takes twenty minutes. PodNotReady is the one that
fires, and the delay is the design working rather than a lag to apologise for:
/health/readyrunsSELECT 1, so it starts returning 503 within seconds./health/livedeliberately does not touch the database. A database blip should not make Kubernetes kill a process that is fine — so the pod staysRunningand goesNotReady, which is exactly the state the alert matches.PodNotReadycarriesfor: 20m, because a pod that is briefly not ready is a rollout, not an incident.
So if you are demonstrating this, lead with the logs and Hubble. The alert is the slow half.
Do not wait for the log-based SLO alert. It cannot fire.
The slo-alerts trait attaches two rules to every component: slo-memory,
which is metric-based and works, and slo-errors, which is log-based and does
not. Log alerting through the Observer is deliberately unimplemented here — the
Loki adapter refuses it rather than accepting a rule and silently dropping it —
so every slo-errors rule on the platform sits in phase: Error, reaches no
backend and produces no PrometheusRule.
This is worth knowing beyond the demo: a component can carry a critical alert
rule that is never going to tell you anything, and the trait that attached it
reports success. Check phase on an ObservabilityAlertRule before trusting it.
It targets staging. The storefront in production is the one thing here with a public hostname, and a deliberate outage should not be the thing that takes it down.
That manifest pointed at a namespace that no longer existed for some days, so the demo applied into nothing and caused no incident — an alerting path that cannot be exercised is one nobody should trust.